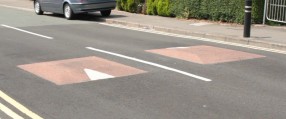
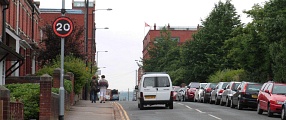
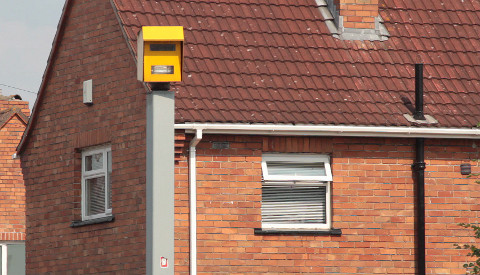
Speed Cameras
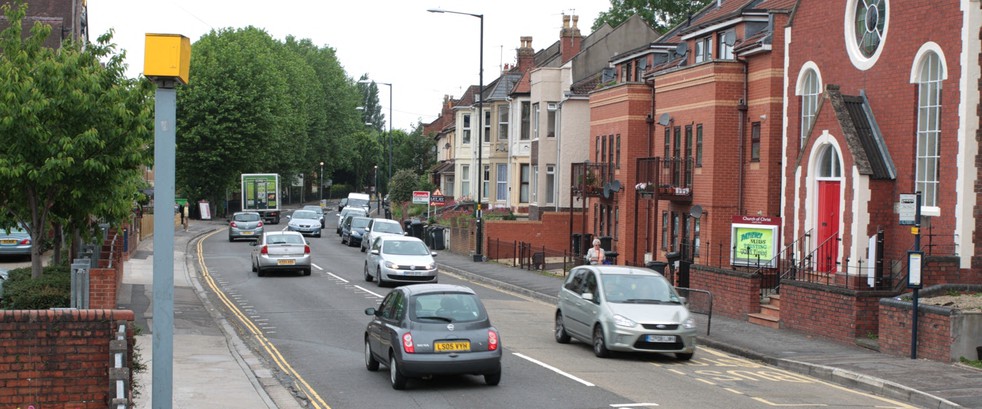
Speed cameras photograph motor vehicles which are travelling over a certain speed - this is usually around 10% over the speed limit. Speed cameras use a radar device to detect the speed of passing motor vehicles.
If the speed camera is in use, motorists are either issued with a fine, or invited to attend a speed awareness course. Both the fine and the cost of the course are around £60, however motorists can avoid penalty points on their license by choosing the course instead of the fine.
Funding
- If the Local authority and the police choose to operate speed cameras together, the money from fines is passed to central government. The local authority or the police do not benefit from fines
- Central government do not provide any incentive for local authorities or the police to enable speed cameras
- If motorists choose to pay for a speed awareness course instead of paying a fine, this money is used differently. In the Avon and Somerset area, this money was used to cover the costs of running the course, maintaining speed cameras, issuing fines, and any other activities which attempt to increase road safety
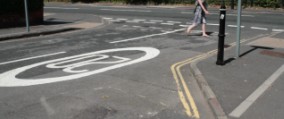
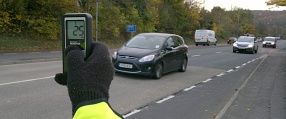
Mobile Speed Cameras
Overview
Mobile speed cameras are operated by officers in the local police force, Avon and Somerset Constabulary. The camera is operated from a vehicle parked at the side of the road in locations where there is a speeding concern. The police could look into setting up a mobile camera location if residents:
- Speak to police officers which attend neighbourhood forum meetings
- Contact the highways team at Bristol Council, who will raise it with the police at monthly catch-up meetings
Effectiveness
Compared to fixed speed cameras, mobile cameras are:
- 25% less effective at preventing people being killed or seriously injured
- Equally effective at preventing accidents where people were injured
Advantages
- Extremely effective at keeping motor vehicles within the speed limit
- Can keep speeds low in the wider area (not just immediately in front of the camera)
- Particularly suited to more busy roads, where vertical or horizontal treatments may cause vehicle traffic queues
- No negative impact on emergency vehicles or buses
Disadvantages
- A funding structure and an agreement with local police are required to operate cameras. This could be difficult to achieve
- Speed cameras have come under criticism from certain sections of the media, with claims that they do not increase road safety, and are only there to generate money for the government. Although speed cameras have proven positive effects, these claims may lead to some opposition to their introduction
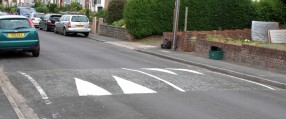
Restrictions
- The following are guidelines from the Department for Transport for speed camera implementation:
- 4 KSIs (Killed or Seriously Injured) per kilometre over the last 3 years
- 8 PIAs (Personal Injury Accidents) per kilometre over the last 3 years
- Speed must be a factor in some or all of the accidents
- 85th percentile speed at least 10% above speed limit plus 2mph - i.e. 35mph in a 30 zone) for free-flowing traffic (excluding any rush-hour periods)
- Must be placed on a relatively straight section of road
There's also some general restrictions to note for all schemes
Effectiveness
Fixed, urban speed cameras reduce injury accidents by around 15% to 20%, and fatal or serious injuries by 20% to 30%.
It's difficult to provide exact figures into the reduction of casualties, as there have been many studies into speed cameras with varying results. However, every study concludes speed cameras significantly reduce road casualties. This was consistent over studies which included the majority of cameras in the UK, and studies which looked at fewer cameras, but used a better study design.
The numbers of motor vehicles breaking the speed limit typically reduces by 10% to 35% near a speed camera. There is a reduction in speed near every speed camera in every study.
Speed cameras are also effective at reducing accidents in the wider area around them. Road casualties are still reduced within 2km of the camera.
Advanced information
Figures stating the reduction in injury and fatal or serious accidents are formed from better quality studies into speed cameras. In this section, a systematic review provides general guidance on effects from international literature, with four UK studies allowing these effects to be narrowed further. Where possible, the effectiveness of urban fixed speed cameras was extracted from these studies as this is most applicable to Bristol.
The Cochrane systematic review by Wilson et al. (2010) found speed cameras reduce injury accidents by 8% to 50%, and fatal or serious injuries by 11% to 44%. This paper selected 35 better quality speed camera studies from around the world for analysis, producing the above figures. The results are largely consistent with another systematic review from Pilkington and Kinra (2005), which was comprised of slightly older literature available at this time. Both studies are critical of research quality into speed cameras, which is "moderate at best" (Wilson et al., 2010), however both conclude the consistent positive effects from research can only indicate a significant safety benefit from speed cameras.
Detailed examination of UK studies
There are individual noteworthy studies from the U.K.; Authors Mountain, Hirst and Maher produced a study in 2004 examining fixed speed cameras with multiple corrections for crude results before/after their placement. This included regression to mean, change in motor vehicle flows, accident trend at sites, and seasonal variation in accidents. Methodologically the paper is very strong, however, with only 62 fixed camera sites, this is a relatively small sample size. Results were a statistically significant 25% reduction in PIAs within 250 meters of the camera, falling to 24% at 1 kilometre. For KSIs, a reduction of 11% was observed at 500 meters, rising to 13% at 1 kilometre, however, these KSI figures are not statistically significant at the 95% confidence interval.
A further noteworthy study from the UK was produced by PA Consulting Group, University College London, University of Liverpool and Napier University in 2005. In contrast to the previous study, many data points were used, but there was no correction for regression to mean or changing motor vehicle flow over time. For urban fixed cameras (2061 sites), the study shows 22.4% reduction in PIAs, with a 46.8% reduction in KSIs. Mountain and Maher - two authors from the previous detailed paper - conducted a separate analysis in the appendix of this report, which included regression to mean correction, but only analysed 52 fixed urban camera sites. This section found a statistically significant reduction of 16.6% for PIAs, and a reduction of 23.5% for KSIs, which was not statistically significant.
A study from the RAC foundation by Allsop (2013) analysed 551 fixed speed camera sites (both urban and rural). This study provides a very up-to-date analysis of speed cameras, employing a relatively strong methodology with regression to mean and accident trend correction. The report found a mean reduction in KSIs of 27%, and reduction in PIAs of 15%. Of the ten partnership areas analysed in this report, one (Merseyside) reported small increases in KSIs and PIAs . it is not clear if this is due to the speed cameras or other, external factors.
Using the UK studies here - giving more weight to recent studies with statistical correction methods - it may be sensible to assume fixed speed cameras reduce PIAs by 15-20%, with KSIs reduced by 20-30%.
Reductions over distances
Speed camera effectiveness over a wider area is based on a study by Hess (2003) which investigated accident changes at different distances around cameras. Based on 49 fixed cameras around Cambridgeshire, the study corrected for regression to mean and seasonality variance. The study provided accident reduction percentages, however these are not comparable to other studies here as they are weighted to include all accident severities . they are used in this context to demonstrate safety benefit over distance only. The accident reduction at 250m from the camera was -45.7%; falling to -41.3% @ 500m; -31.6% @ 1000m; -20.8% @ 2000m. Just under half the safety benefit is still evident 2000m away from the camera, compared to very near the camera (250m).
Mobile camera effectiveness
Information on mobile speed cameras is based on the paper from PA Consulting (2005). Both the main body analysis of this article and the appendix analysis (by Mountain & Maher) show almost equal effects of fixed and mobile speed cameras with injury collisions (the appendix analysis showed the effects slightly increased). For killed or seriously injured accidents, mobile speed cameras were 25.4% and 25.1% less effective than fixed cameras in the main body and appendix respectively.
References
Allsop, R. (2013) Guidance on Use of Speed Camera Transparency Data. University College London (report for the RAC Foundtion).
Gains, A., Nordstorm, M., Heydecker, B., Shrewsbury, J. (2005) The national safety camera programme: Four-year evaluation report. PA Consulting & University College London. (Data analysis in the appendix from Mountain, L. & Maher, M.)
Hess, S. (2004) An analysis of the effects of speed limit enforcement cameras with differentiation by road type and catchment area. Transportation Research Record 1865, pp. 28-34.
Mountain, L., Hirst, W., Maher, M. (2004) Costing lives or saving lives: a detailed evaluation of the impact of speed cameras. Traffic Engineering & Control 45 (8) pp. 280 . 287.
Pilkington, P. & Kinra, S. (2005) Effectiveness of speed cameras in preventing road traffic collisions and related casualties: systematic review. BMJ 330 pp. 331 . 334.
Wilson, C., Willis, C., Hendrikz, JK., Le Brocque, R., Bellamy, N. (2010) Speed cameras for the prevention of road traffic injuries and deaths (Review). The Cochrane Collaboration. John Wiley & Sons.