Vehicle-activated Signs (VAS)
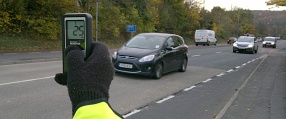
Vehicle-activated signs (VASs) are an electronic sign which only become visible when approaching motor vehicles are exceeding a certain speed.
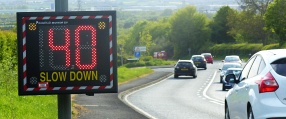
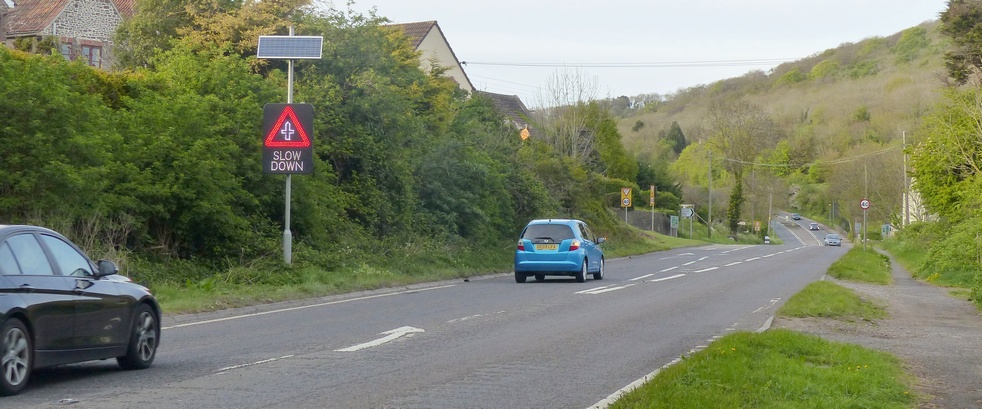
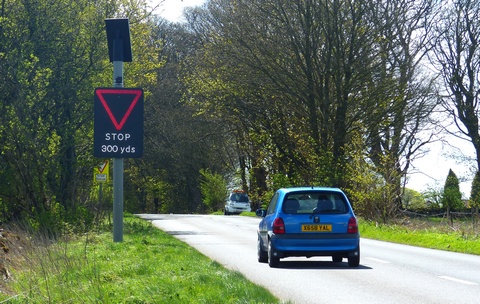
The signs can display the speed limit, or they can warn drivers of an approaching hazard (e.g. a bend or junction).
VASs are formed of many bright lights which only turn on when the target motor vehicle is in plain view of the sign and exceeds the pre-set activation speed.
Advantages
- No discomfort or delay experienced by any vehicle user, in comparison to some other measures
- Relatively cheap
- Continue to have a positive effect over time
- Can be installed where there is no electricity connection (using solar power and batteries)
Policy details on VASs
Somerset County Council has an official policy on VASs, which can be found here.
Disadvantages
- Not as effective as physical interventions which are 'vertical'
- Too many vehicle-activated signs could diminish their effectiveness
- VASs can be expensive to maintain
Effectiveness
For this section, research has split Vehicle-activated signs into two categories; roundel signs, which show the speed limit; and warning signs, which advise of an upcoming bend or junction.
Accidents
Speed limit roundel signs reduce accidents by around 31%. Specifically for roads with lower speed limits (30 or 40 mph), Vehicle-activated signs have shown increased effectiveness, and reduced accidents by 34%.
Junction or bend warning signs typically reduce accidents by around 26%.
These accident reductions mean vehicle activated signs are very similar to horizontal treatments in their effectiveness.
Speeds
Roundel signs on 30 mph roads have reduced motor vehicle speeds between 2.6 to 7.1 mph. The amount of motorists exceeding the speed limit dropped between 18 to 34 percentage points.
Junction and bend warning signs are likely to reduce speeds by around 3.8 to 6 mph on average, however their effect is more variable, with speeds changing between +1.2 and -9.2 mph.
Time
Research has examined if VASs still have a positive effect on driver behaviour after one year of installation. It was found the signs still maintained their positive effects.
Restrictions
- Vehicle-activated signs must be placed on a straight stretch of road to allow the radar device to accurately judge the speed of approaching motor vehicles
- Guidance from the Department for Transport suggests these signs should only be considered where other measures have not been effective
There's also some general restrictions to note for all schemes
Advanced information
Accidents at Vehicle-activated signs
Accident reduction figures for roundel signs are from a medium quality study from TRL into VASs (Winnett & Wheeler, 2002). Whilst the study examined VASs at a range of locations using before/after methodology, a more detailed analysis was also carried out in Norfolk at 21 VAS sites using a modelling technique based on eleven years accident data (1990-2000). To reach the roundel accident reduction figures, the model predicted the number of accidents within Norfolk if no VASs had been installed, compared with the observed number of accidents with the VASs. This methodology should provide a reasonably accurate indication of safety effects, however there is no explicit implementation of long term trend correction for accidents which may offset effects by a small, but significant amount.
Using a simple before / after study design (which is less rigorous than the analysis used above), the same paper reported results for bend and junction warning signs. This figure was based on 5 VASs, with three of these sites having only one year of ‘after’ data - this forms a poor methodology, but demonstrates that warning signs are expected to be slightly less effective than roundel signs.
Speeds at Vehicle-activated signs
Similarly, vehicle speeds at VASs are based on the same TRL study (Winnett & Wheeler, 2002). The methodology is of medium strength - the data were collected using a covert and accurate technique over a long time period, however there was a small variance in distance between data collection and the VASs. Data were collected before sign installation, within one month after installation, and after one year. Overall, the data provides a strong indication of VAS effects, despite some flaws. The data provided for both 40mph and 50mph sites was not included, as there were too few data points for a reliable analysis.
Specifically for junction and bend warning signs, the speed reduction figures were aggregated together, as similar effects were reported (there were only three data points for bend warning signs, however). Using this study, the speed reduction calculated for both signs was 3.8 mph. Another study from Jamson et al. (2010)* reported speed reductions of around 6 mph using a VAS with a junction warning, when used in a rural context. The speed of 3.8 to 6 mph is therefore used above, to account for results from both these studies.
*The Jamson et al (2010) paper is based on a good quality simulator research study into speed reducing treatments. The research specifically compared UK treatments on UK style roads. The research findings are considered to be very conservative, as the study only recruited young (19 to 25 years old) male drivers - younger drivers, and specifically young male drivers are most likely to be speeding, therefore research which is found to be effective on this group is thought to be at least equally effective on other vehicle users. It could be considered likely that speed reduction may be greater across an average cross section of drivers (outside this young male group).
References
Jamson, S., Lai, F., Jamson, H. (2010) Driving simulators for robust comparisons: A case study evaluating road safety engineering treatments. Accident Analysis and Prevention 42 pp. 961 . 971.
Mountain, L., Hirst, W., Maher, M. (2005) Are speed enforcement cameras more effective than other speed management measures? The impact of speed management schemes on 30 mph roads. Accident analysis and prevention 37 pp. 742 . 754.
Winnett, M. & Wheeler, A. (2002) Vehicle-activates signs - a large scale evaluation (TRL548). Transport Research Laboratory. Crowthorne, UK.