Speed Table
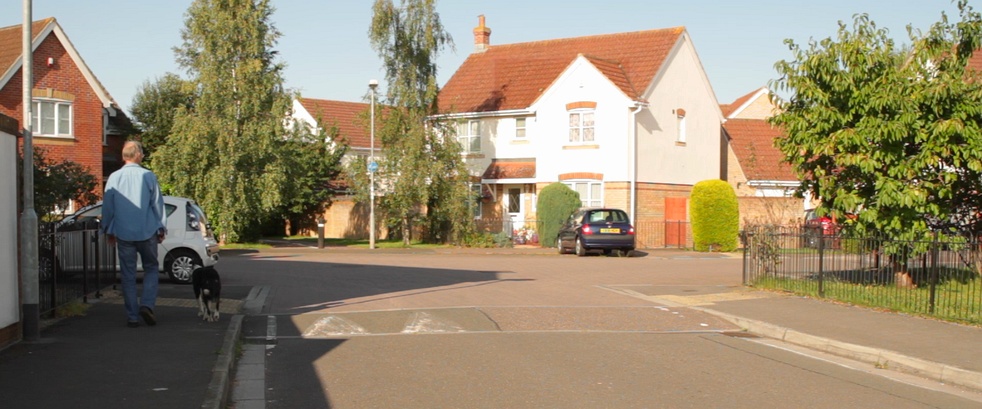
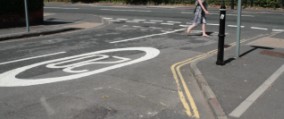
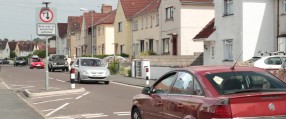
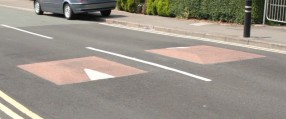
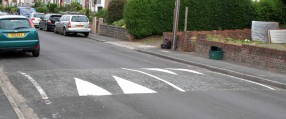
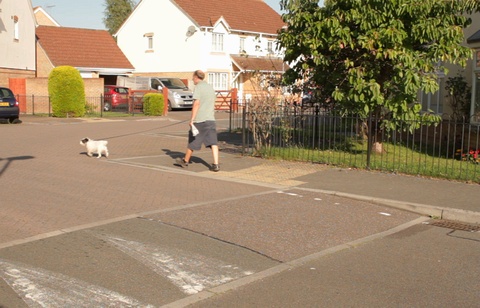
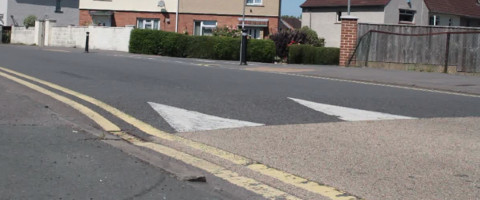
Speed tables are a raised section of road over a junction, with a ramp on each arm of the junction. The ramps are painted with white arrows to make them more obvious to motor vehicle drivers.
The aim of the speed table is to slow motor vehicle traffic to a safe speed, as the ramps become uncomfortable for vehicle drivers if they are driven over too fast.
A speed table is normally around 75mm high across the whole junction, and can vary in length.
Disadvantages
- Large speed tables are expensive
- Managing water drainage could be complex and costly
- Buses, cyclists and emergency vehicles will need to reduce their speed
- Some traffic is likely to transfer onto alternative routes, potentially causing a problem somewhere else
- Signs are required to warn drivers of speed tables, and these contribute to sign clutter
- These signs must be illuminated, which may caused further concerns in conservation areas
Considerations
- May cause traffic to divert to other routes
- Speed tables could create noise and vibration which is heard and felt in residences nearby. A greater distance between the speed table and residences will reduce this problem.
- Require a 'Road Hump regulation order' before installation
Advantages
- Can be used as part of an informal crossing for pedestrians
- More acceptable than speed humps to buses
- The size of the speed table is flexible to fit an area with a safety concern. It could span all parts of a four-arm junction, or be placed in other specific parts of the road
Effectiveness
Generally, vertical treatments - such as speed tables - are expected to reduce accidents by around 44%.
Motor vehicles are likely to travel at around 13 mph over a speed table. If there's more than one speed table, motor vehicles are likely to travel at 20 mph between them. These are the lowest speeds of all traffic calming treatments compared on Traffic Choices, which means the greatest safety benefit can be expected.
Reducing motor vehicle speeds increases safety because:
- The vehicle has travelled less distance before the driver can react to a hazard
- Braking distance is reduced, so the vehicle can stop more quickly before a hazard
- A slower moving vehicle will exert less energy on occupants as the vehicle rapidly changes speed on impact (crashes)
- A slower moving vehicle will transfer less energy to a pedestrian in the event of a collision.
Restrictions
- Normally only used in residential areas or busy pedestrian areas
- May be unacceptable on a busy bus route
There's also some general restrictions to note for all schemes
Advanced information
Likely motor vehicle speeds when travelling over a speed table are taken from TRL report 186 (Webster & Layfield, 1996). The research was based on Local Authority data at thirty-nine 60mm to 80mm high flat-top humps from around England. All sites had a 30 mph speed limit except fourteen, which had 20 mph speed limits. The speeds between humps are based on an average separation of 84m between the devices, with an 85th percentile speed of 25mph. Overall, the quality of this study is very poor . there is no methodological detail given, including use of control sites, or before/after data collection periods. In the absence of other, specific analysis on flat-top humps, this paper is used as a guide for effects on speed.
44% reduction in accidents is taken from Mountain, Hirst and Maher (2005). The study calculated accident reductions from various different types of traffic calming measures. Local authority and police data were used throughout Great Britain from 150 speed management schemes on 20 mph roads. Analysis is particularly strong, with correction for change in flow, accident trend and regression to mean.
Factors associating reduced motor vehicle speed to road safety are based around Wilson et al. (2010), who note the large body of research consistently linking casualty rate with speed (e.g. TRL 421).
References
Mountain, L., Hirst, W., Maher, M. (2005) Are speed enforcement cameras more effective than other speed management measures? The impact of speed management schemes on 30 mph roads. Accident analysis and prevention 37 pp. 742 . 754.
Taylor, M., Lyman, D., Baruya, A. (2000) The effects of drivers. speed on the frequency of road accidents (TRL421). Transport Research Laboratory. Crowthorne, UK.
Webster, D. & Layfield, R. (1996) Traffic calming - road hump schemes using 75mm high humps (TRL186). Transport Research Laboratory. Crowthorne, UK.
Wilson, C., Willis, C., Hendrikz, JK., Le Brocque, R., Bellamy, N. (2010) Speed cameras for the prevention of road traffic injuries and deaths (Review). The Cochrane Collaboration. John Wiley & Sons.
